How To Embed Animation Into Jupyter Notebook
Python #Plot
Recently I struggled to choose the right way to write python. I’m not willing to use bloatware such as spyder to write. Since I want to feel very free when I want to start to write. This could be done via text eidter such as sublime text or vs code. However, my another demand is to write the note and code in the same file. This demand could be best solved via jupyter notebook when you want to solve something and show how you solve it.
I have tested the way of animating the plot by using the package Matplotlib. A more natural idea is that can the animated plot be shown in jupyter notebook. After searching in the web I know this couldn’t be solved directly. Different people offer different solutions. I choose the most simple and direct solution (at least in my mind). This is the solution.
Here is a simple examle from this web
1 | from matplotlib import animation |
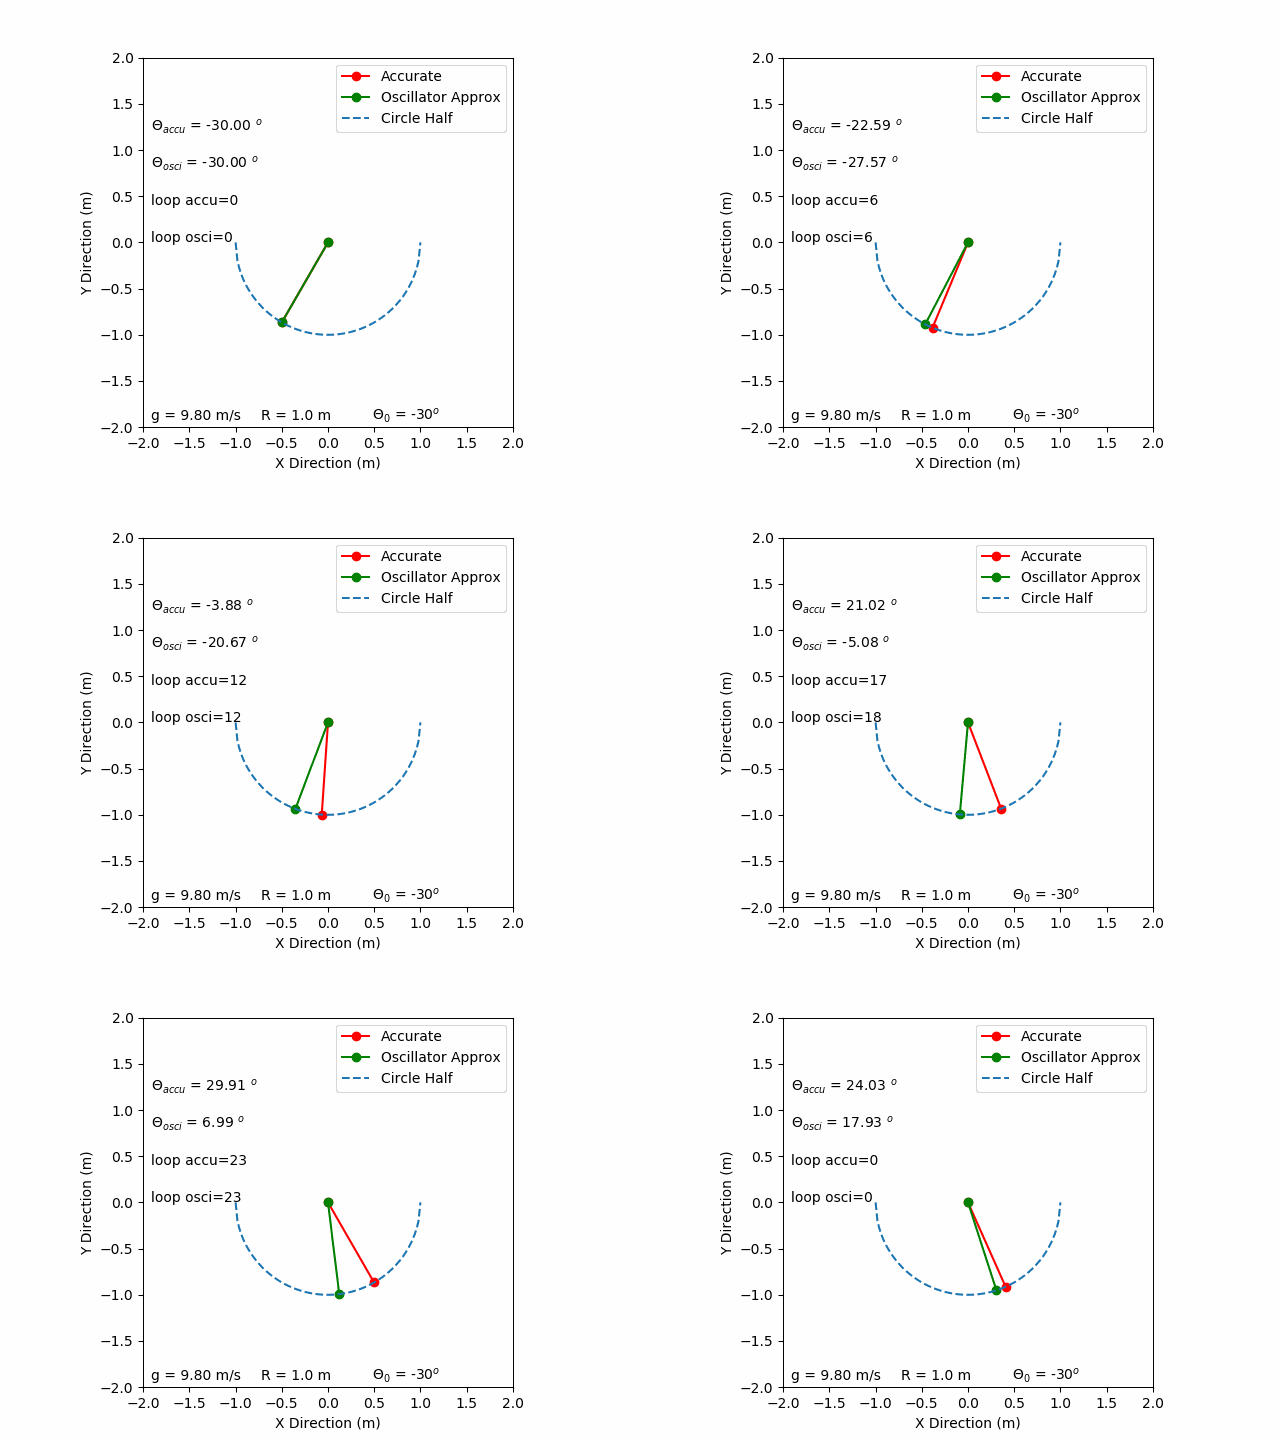
I want tp try this method and I hope to use one of my original program which shows the difference between the actual case and harmonic oscillator approximation when a sphere slides down from a semi-circle. I want show show the plot displyed in the jupyter notebook and can be controled via some buttons. This can be realized by directly adding two extra lines into the original program. To show the animation like a video in the jupyter notebook,
1 | from IPython.display import HTML |
Then you will see the following animated video in the explorer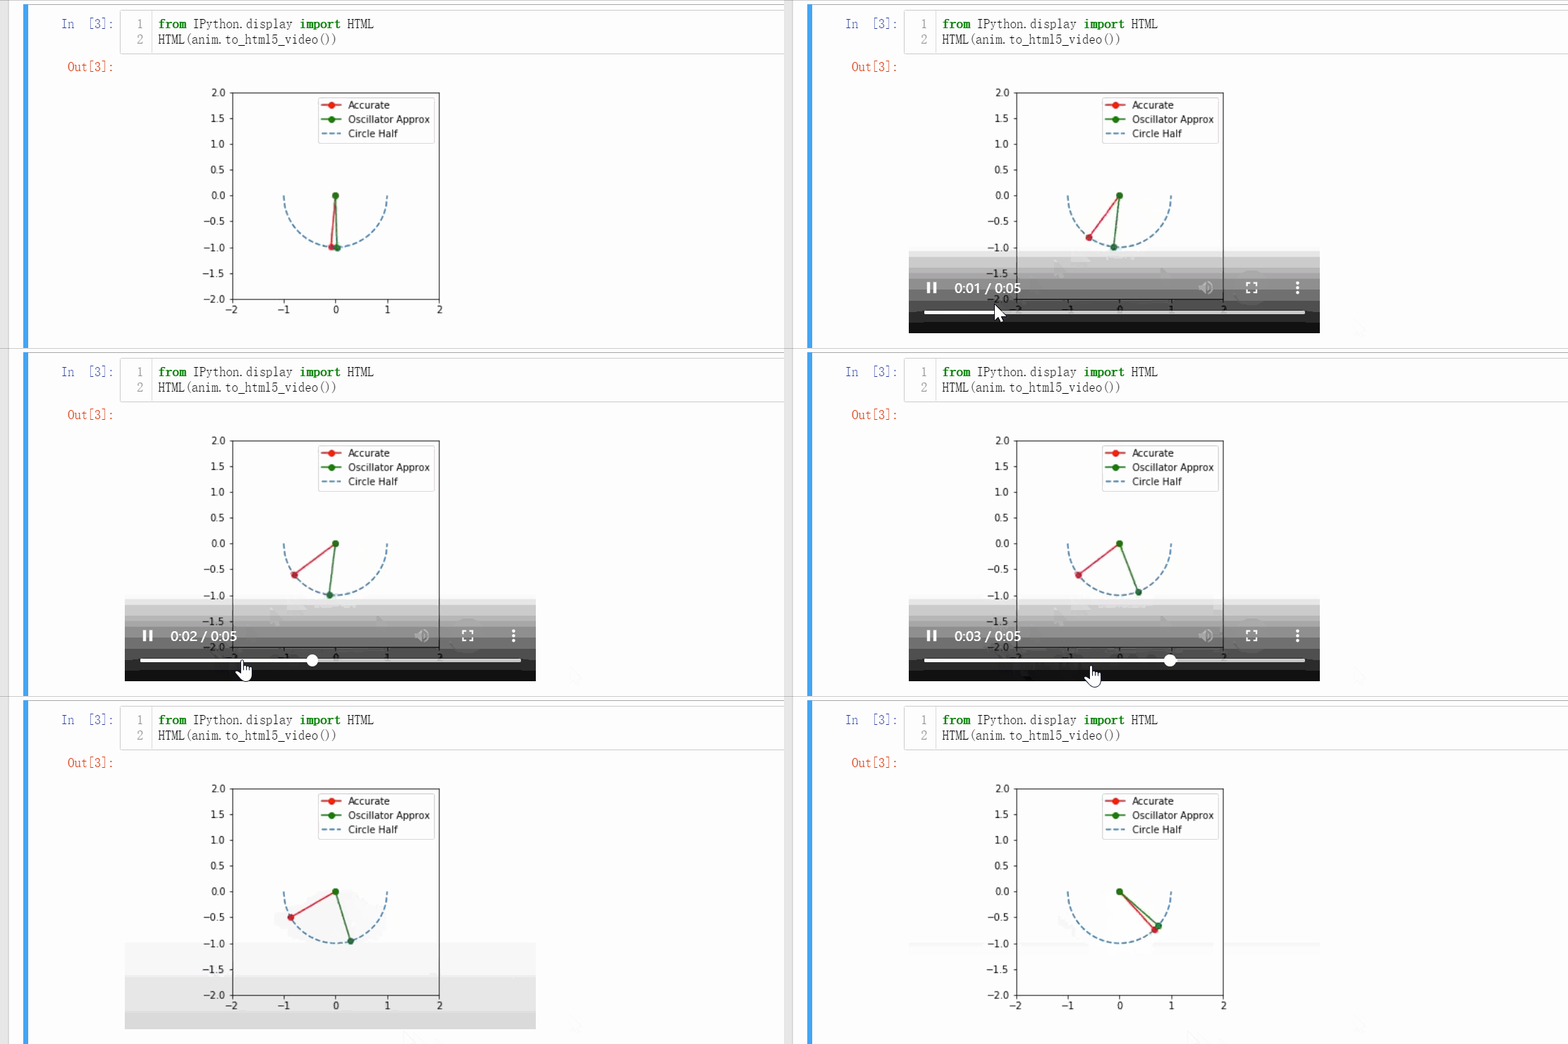
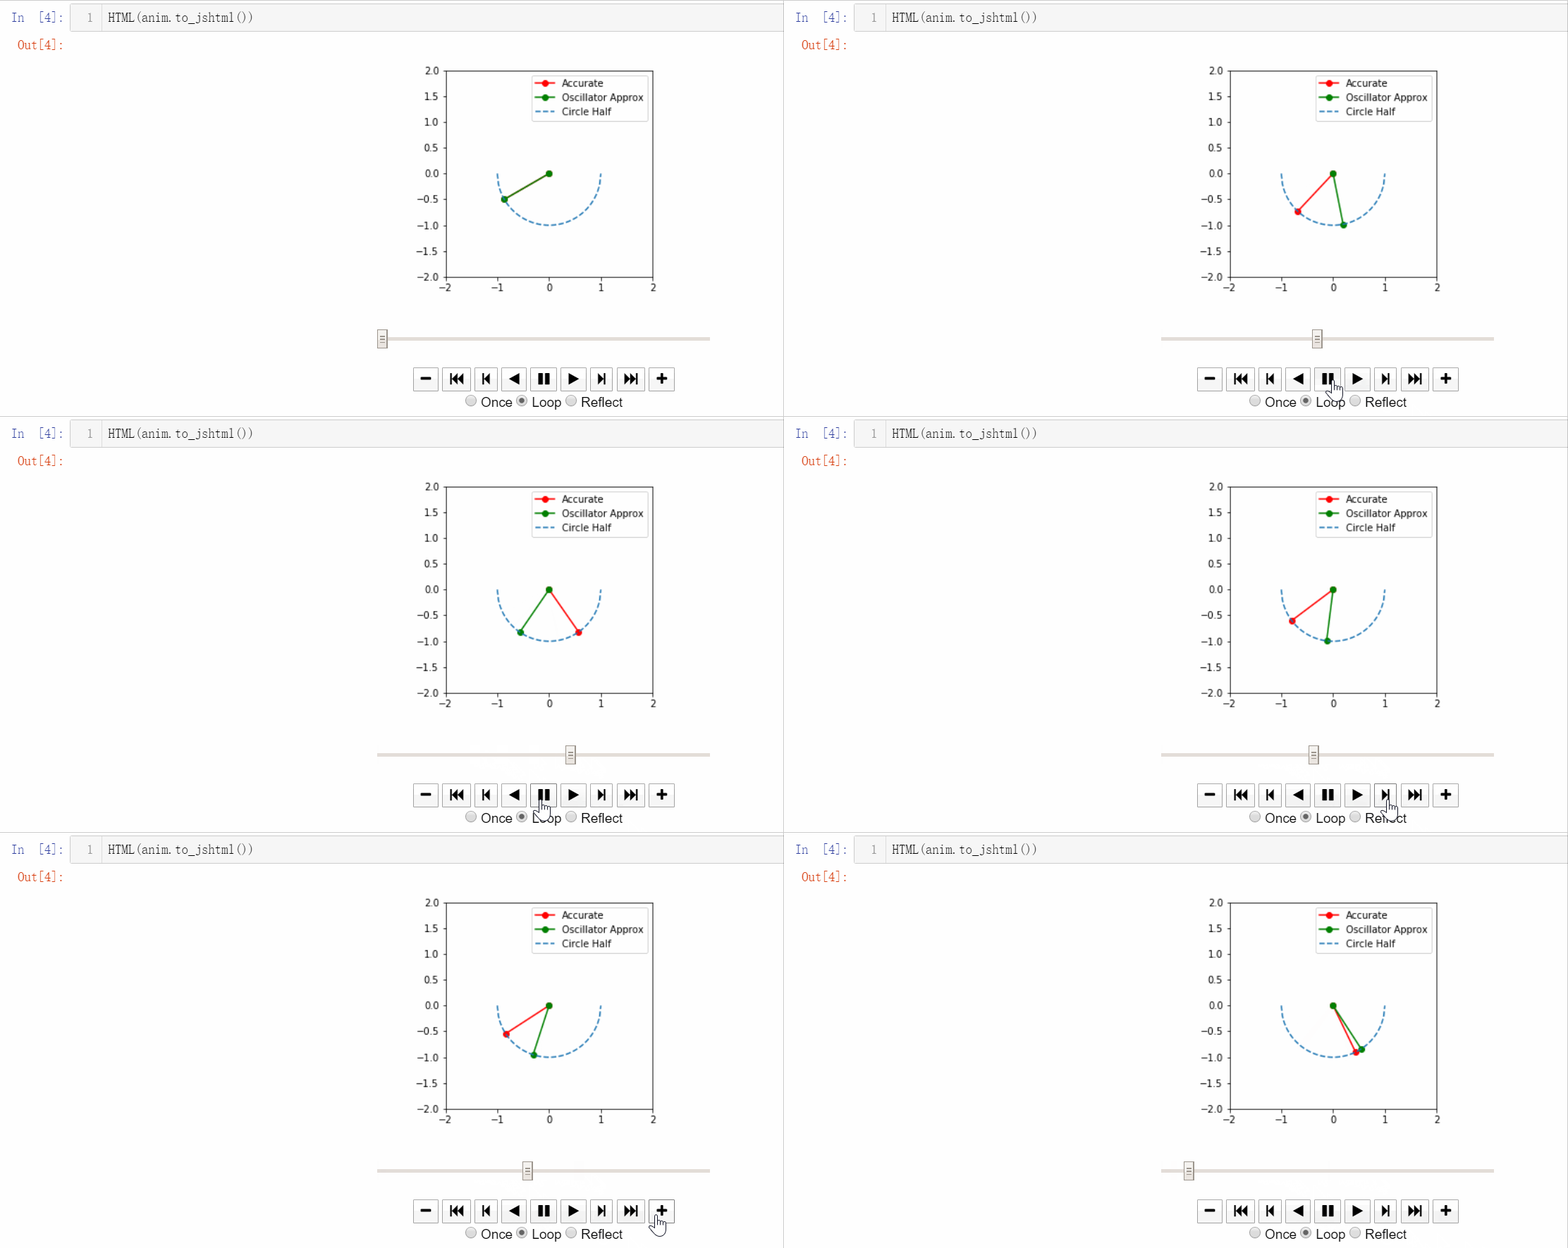
If you want to control the animated plot, you could type
1 | HTML(anim.to_jshtml()) |
then you can control the animated plot by hand.
