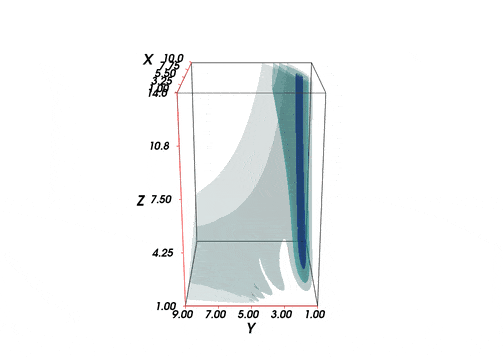
A rotated flower plotted via python (animated)
Python #Plot
All the python study code can be found in my own repository.
As a study of Python data visualization, I plot a 3D follower and let it rotated horizontally. The packages I used are
1 | import subprocess |
The follower is defined via the following data
1 | [x, t] = np.meshgrid(np.array(range(25))/24.0, |
and the init function is as follows
1 | def init(): |
An animate function
1 | def animate(i): |
plot and save1
2
3
4
5
6
7
8
9
10n = 'rotate_azimuth_angle_3d_flower'
# ani.save(fn+'.mp4',writer='ffmpeg',fps=1000/50)
ani.save(fn+'.gif', writer='imagemagick', fps=1000/50)
cmd = 'magick convert %s.gif -fuzz 5%% -layers Optimize %s_r.gif' % (fn, fn)
subprocess.check_output(cmd)
plt.rcParams['animation.html'] = 'html5'
ani
The generated flowers are as follows
All articles in this blog are licensed under CC BY-NC-SA 4.0 unless stating additionally.
Related Articles
Comment