Python #Plot

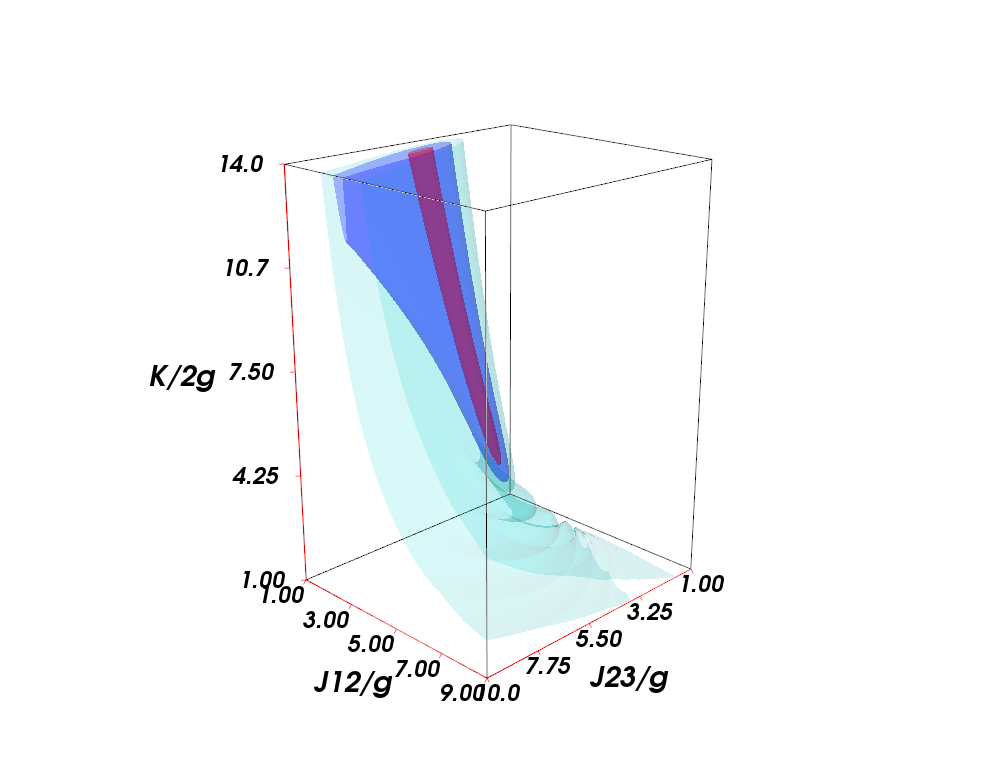
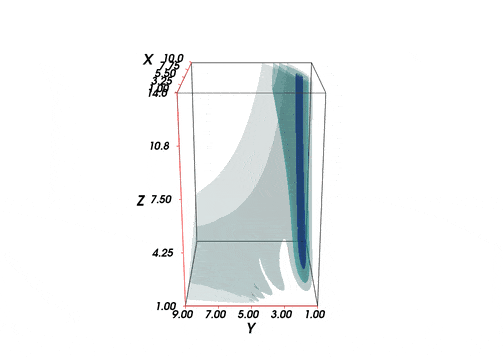
Recently I am interested in the data visualization and I have try different plots. Previously in my research work I ploted a 3d contour figure via MATLAB. Since the frequently used Python package Matplotlib has poor support on this kind of 3d data visualization. I also tried the Mayavi package before and I didn’t learn it well.

After reading a lot of examples I begin to control the skill of using Mayavi. I try to replot the original plots via python.

Here is the process. We first need import the necessary package

1
2
import numpy as np
from mayavi import mlab

Then the 3d data should be prepared. The data are calculated via parameter sweep and store with txt format. We need load it

1
2
3
4
5
6
7
8
9
10
11
12
# %% Load the data
dis_tri = np.loadtxt('../3D_Animation/BigRangeSweep3Cav.txt')
# %%
num_J12 = 199
num_J23 = 200
num_kappa = 201
J12_mat = np.linspace(1, 9, num_J12)
J23_mat = np.linspace(1, 10, num_J23)
kappa_mat = np.linspace(1, 14, num_kappa)

xx, yy, zz = np.mgrid[1:14:201j, 1:10:200j, 1:9:199j]
sym_mat = np.reshape(dis_tri, (num_kappa, num_J23, num_J12))

We need transpose the matrix since I need kappa to be the z axi

1
2
sym_mat_tr = sym_mat.transpose(1, 2, 0)
xx_tr, yy_tr, zz_tr = np.mgrid[1:10:200j, 1:9:199j, 1:14:201j]

Then we can plot the 3d data

1
2
3
4
5
6
7
8
9
10
11
12
13
14
15
16
fig_extent = [1, 10, 1, 9, 1, 14]
fig1 = mlab.figure(size=(1000, 800), bgcolor=(1, 1, 1), fgcolor=(0, 0, 0))
s = mlab.contour3d(xx_tr, yy_tr, zz_tr, sym_mat_tr, color=(0, 0.7, 0.7), contours=[
0.8], transparent=True, opacity=0.15) # ,extent=fig_extent)
mlab.contour3d(xx_tr, yy_tr, zz_tr, sym_mat_tr, color=(0, 0, 1), contours=[
0.9], transparent=True, opacity=0.3) # ,extent=fig_extent)
mlab.contour3d(xx_tr, yy_tr, zz_tr, sym_mat_tr, color=(1, 0, 0), contours=[
0.97], transparent=True, opacity=0.4) # ,extent=fig_extent)
mlab.outline(extent=fig_extent)
mlab.xlabel('J23/g')
mlab.ylabel('J12/g')
mlab.zlabel('K/2g')
mlab.view(180 + 45, -70, 42, [5.5, 5, 7.5])
mlab.axes(color=(1, 0, 0), nb_labels=5)
mlab.savefig('sym_distri_static_Python.png')
mlab.show()

I have used the function contour3d and its usage can be found in the mayavi doc web.

The following is the figure I plotted.

3d Contour plots