MATLAB #Plot

Data Visualization Via MATLAB (3 dimensional data)

The three dimensinal data are composed of matrix. Its data also has the position matrix. (x,y,z). We can plot the isosurface, contourlines, slice plots etc for this kind of data.

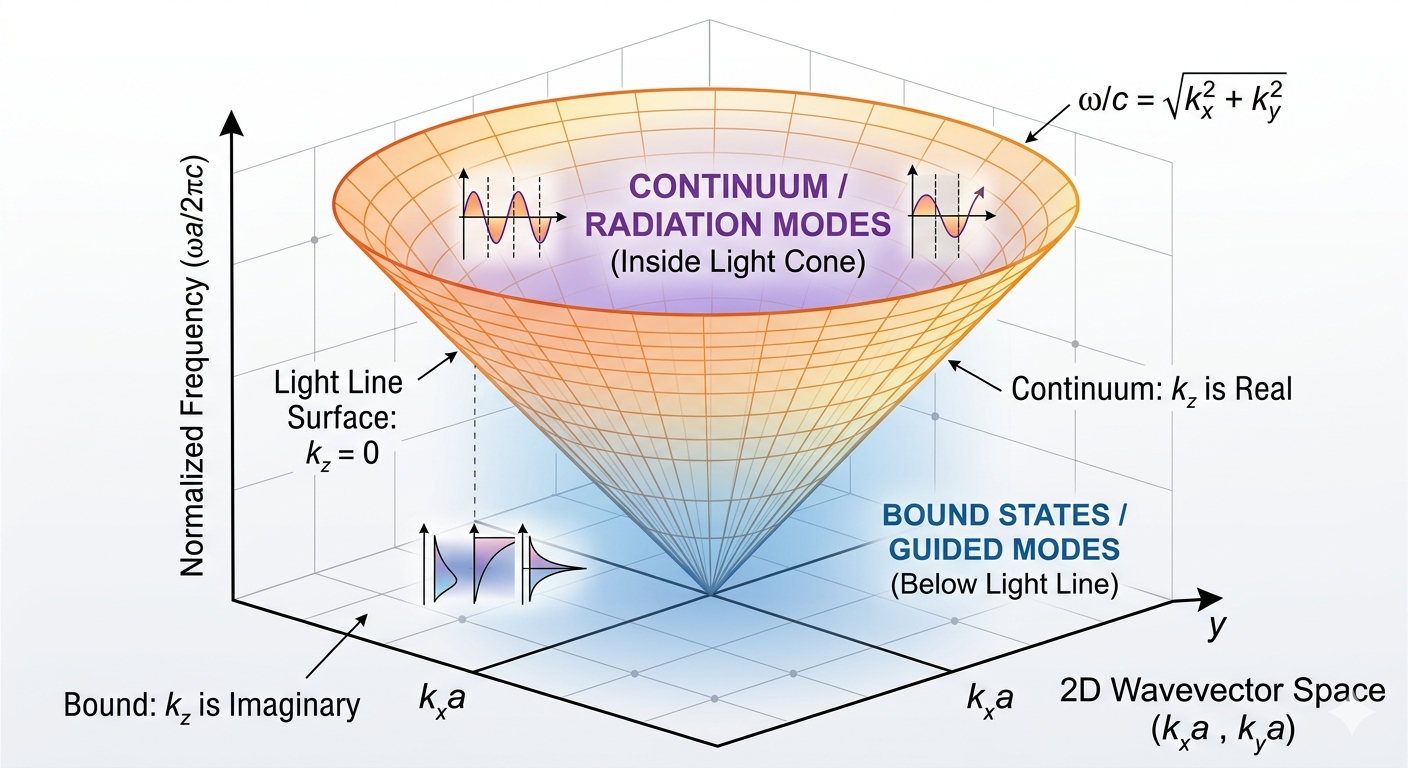
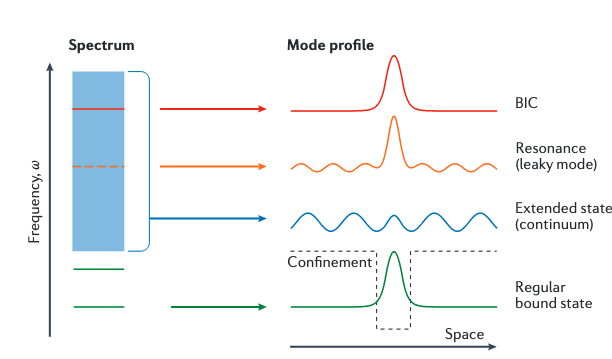
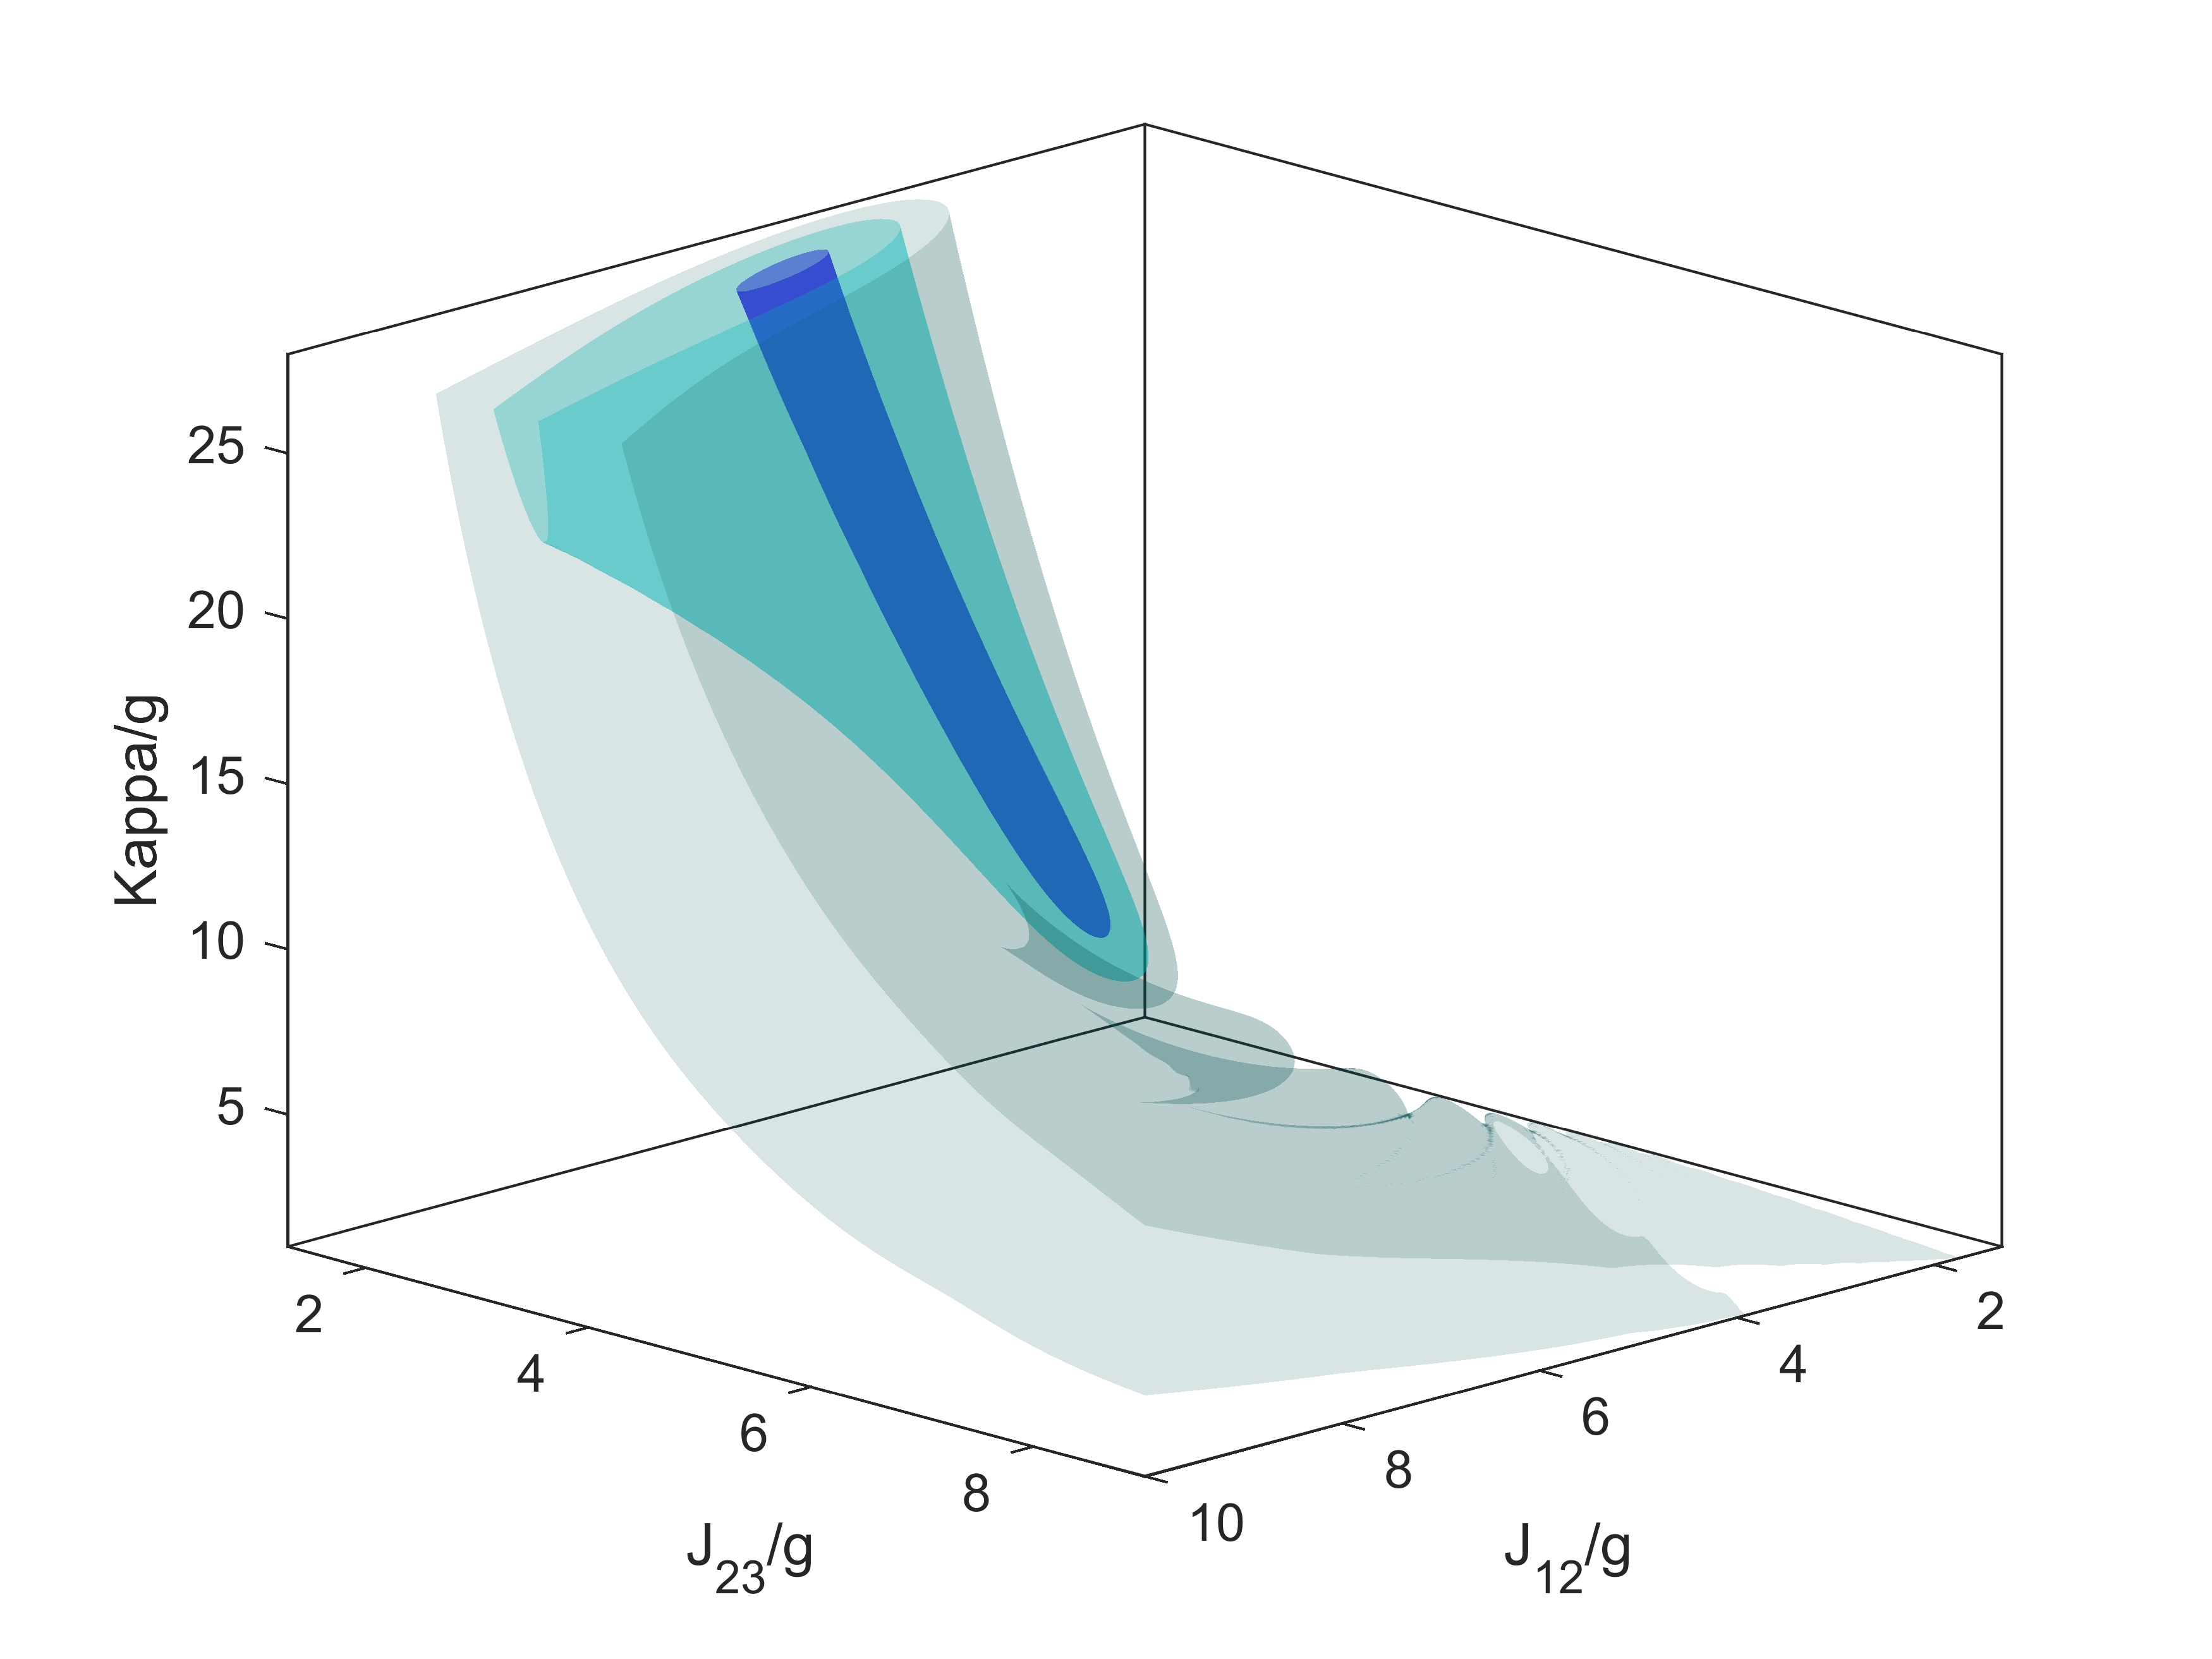
3d Contour Surface Plots

We should extract the contour data via the function isosurface. Though I have completed the figure, I can’t understand the reason. I will give issulation later.

1
2
3
4
5
6
7
8
9
10
11
12
13
14
15
16
17
18
19
20
21
22
23
24
25
26
27
28
29
30
31
32
33
34
35
36
37
38
39
40
41
42
43
44
45
46
47
48
49
50
51
52
53
54
55
56
57
58
% As a study of 3D data visualization using MATLAB
% Author Zhaohua Tian
% Email:knifelees3@gmail.com
% The figures in the Ref: "Quantum photonic node for on-chip state transfer" (https://arxiv.org/abs/1908.03683)
A=dlmread('../3D_Animation/BigRangeSweep3Cav.txt');
num_J12=199;
num_J23=200;
num_kappa=201;
max_sym=reshape(A,[num_J12,num_J23,num_kappa]);


J12_mat=linspace(1,9,num_J12);
J23_mat=linspace(1,10,num_J23);
kappa_mat=linspace(1,28,num_kappa);
[xx,yy,zz]=meshgrid(J23_mat,J12_mat,kappa_mat);

%%
%get the figures
h=figure(1)
ax = axes('Parent',h);
p1 = patch(isosurface(xx,yy,zz,max_sym,0.8));
isonormals(xx,yy,zz,max_sym,p1)
p1.FaceAlpha=0.15;
p1.FaceColor=[0,0.3 0.3];
p1.EdgeColor='none';
hold on

p2 = patch(isosurface(xx,yy,zz,max_sym,0.9));
isonormals(xx,yy,zz,max_sym,p2)
p2.FaceAlpha=0.3;
p2.FaceColor=[0 0.7 0.7];
p2.EdgeColor='none';
hold on

p3 = patch(isosurface(xx,yy,zz,max_sym,0.97));
isonormals(xx,yy,zz,max_sym,p3)
p3.FaceAlpha=0.4;
p3.FaceColor=[0 0 0.8];
p3.EdgeColor='none';
hold on
%daspect([1 1 1])
view(135,20);
axis tight
%camlight('headlight','infinite')
lighting('flat')
box('on')
lighting gouraud
xlabel('J_{12}/g')
ylabel('J_{23}/g')
zlabel('Kappa/g')
print('./sym_distri_static_MATLAB.png', '-dpng', '-r600')
% axis('off')
% print('../Figures/BigRangePureFig.png', '-dpng', '-r600')
% axis('on')
% p1.FaceColor='none';
% p2.FaceColor='none';
% p3.FaceColor='none';
% print('../Figures/BigRangeFrame.eps', '-depsc', '-r600')

The generated plot are as follows

Generated 3D contour plots