1
2
3
4
5
6
7
8
9
10
11
12
13
14
15
16
17
18
19
20
21
22
23
24
25
26
27
28
29
30
31
32
33
34
35
36
37
38
39
40
41
42
43
44
45
46
47
48
49
50
51
52
53
54
55
56
57
58
59
60
61
62
63
64
65
66
67
68
69
70
71
72
73
74
75
76
77
78
79
80
81
82
83
84
85
86
87
88
89
90
91
92
93
94
95
96
97
98
99
100
101
102
103
104
105
106
107
108
109
110
111
112
113
114
115
116
117
118
119
120
121
|
import matplotlib.pyplot as plt
import numpy as np
from mpl_toolkits.mplot3d import Axes3D
from matplotlib.patches import FancyArrowPatch
from mpl_toolkits.mplot3d import proj3d
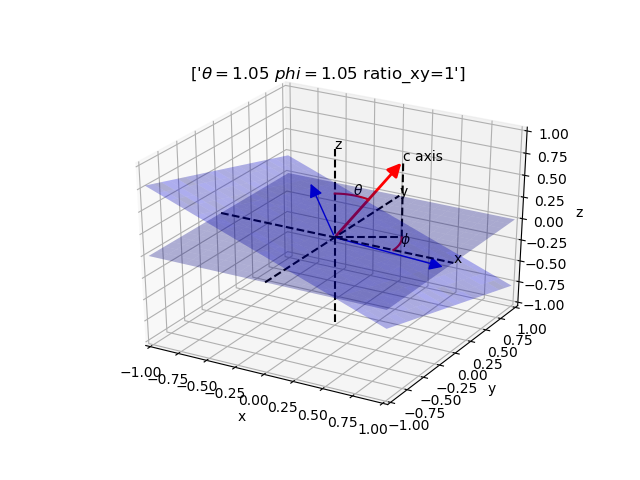
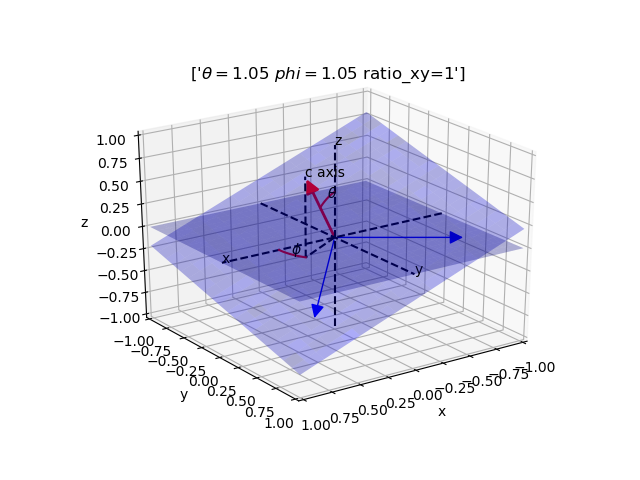
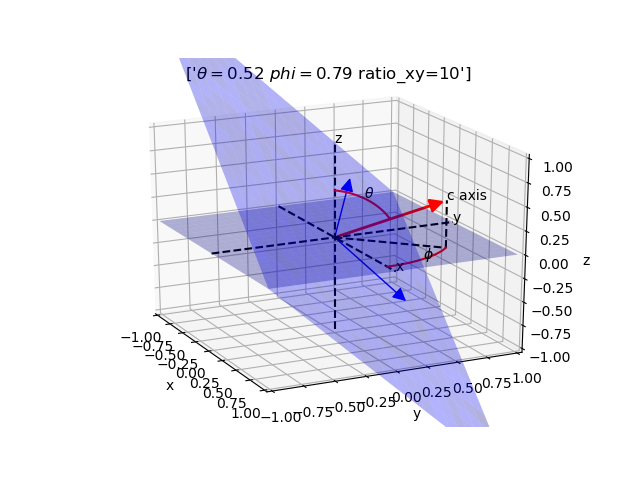
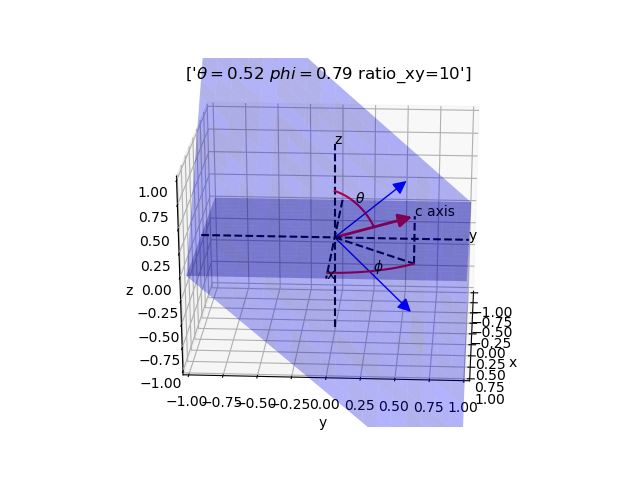
theta = np.pi / 6
phi = np.pi / 4
class Arrow3D(FancyArrowPatch):
def __init__(self, xs, ys, zs, *args, **kwargs):
FancyArrowPatch.__init__(self, (0, 0), (0, 0), *args, **kwargs)
self._verts3d = xs, ys, zs
def draw(self, renderer):
xs3d, ys3d, zs3d = self._verts3d
xs, ys, zs = proj3d.proj_transform(xs3d, ys3d, zs3d, renderer.M)
self.set_positions((xs[0], ys[0]), (xs[1], ys[1]))
FancyArrowPatch.draw(self, renderer)
num_arrow = 3
coor0 = np.zeros((1, 3))
row = np.ones((num_arrow, 1))
coor = np.matmul(row, coor0)
x = np.cos(theta) * np.sin(phi)
y = np.cos(theta) * np.cos(phi)
z = np.sin(theta)
ar_1 = np.array([x, y, z])
nar_1 = ar_1 / np.sqrt(ar_1[0] ** 2 + ar_1[1] ** 2 + ar_1[2] ** 2)
ratio_xy = 10
ar_2 = np.array([1, ratio_xy, -y / z * ratio_xy - x / z])
nar_2 = ar_2 / np.sqrt(ar_2[0] ** 2 + ar_2[1] ** 2 + ar_2[2] ** 2)
nar_3 = np.cross(nar_1, nar_2)
num = 20
x_mat = np.linspace(-1, 1, num)
z_mat = np.linspace(0, 1, num)
line_1_xy = np.array([(z_mat)*x, (z_mat)*y, (z_mat)*0])
line_1_z = np.array([np.ones(num)*x, np.ones(num)*y, (z_mat)*z])
line_x = np.array([x_mat, x_mat*0, x_mat*0])
line_y = np.array([x_mat*0, x_mat, x_mat*0])
line_z = np.array([x_mat*0, x_mat*0, x_mat])
xx, yy = np.meshgrid(x_mat, x_mat)
zz_xy = np.zeros((num, num))
zz_or = (-x*xx-y*yy)/z
theta_x = z_mat*x*0.5
theta_y = z_mat*y*0.5
theta_z = np.sqrt(0.25-theta_x**2-theta_y**2)
phi_y = np.linspace(0, y, num)
phi_x = np.sqrt(x**2+y**2-phi_y**2)
phi_z = np.zeros(num)
fig = plt.figure()
ax = fig.gca(projection='3d')
a1 = Arrow3D([0, nar_1[0]], [0, nar_1[1]], [0, nar_1[2]], mutation_scale=20,
lw=2, arrowstyle="-|>", color="r")
ax.add_artist(a1)
a2 = Arrow3D([0, nar_2[0]], [0, nar_2[1]], [0, nar_2[2]], mutation_scale=20,
lw=1, arrowstyle="-|>", color="b")
ax.add_artist(a2)
a3 = Arrow3D([0, nar_3[0]], [0, nar_3[1]], [0, nar_3[2]], mutation_scale=20,
lw=1, arrowstyle="-|>", color="b")
ax.add_artist(a3)
a4 = ax.plot(line_1_xy[0, :], line_1_xy[1, :], line_1_xy[2, :], 'k--')
a5 = ax.plot(line_1_z[0, :], line_1_z[1, :], line_1_z[2, :], 'k--')
ax_x = ax.plot(line_x[0, :], line_x[1, :], line_x[2, :], 'k--')
ax_y = ax.plot(line_y[0, :], line_y[1, :], line_y[2, :], 'k--')
ax_z = ax.plot(line_z[0, :], line_z[1, :], line_z[2, :], 'k--')
surf_xy = ax.plot_surface(xx, yy, zz_xy, alpha=0.3, color=(0, 0, 1))
surf_or = ax.plot_surface(xx, yy, zz_or, alpha=0.3, color=(0, 0, 1))
theta_angle = ax.plot(theta_x, theta_y, theta_z, 'r-')
phi_angle = ax.plot(phi_x, phi_y, phi_z, 'r-')
ax.set_xlim((-1, 1))
ax.set_ylim((-1, 1))
ax.set_zlim(-1, 1)
ax.text(0, 0, 1, 'z')
ax.text(1, 0, 0, 'x')
ax.text(0, 1, 0, 'y')
ax.text(x, y, z, 'c axis')
ax.text(theta_x[10], theta_y[10], theta_z[10], '$\\theta$')
ax.text(phi_x[10], phi_y[10], phi_z[10], '$\\phi$')
ax.set_xlabel('x')
ax.set_ylabel('y')
ax.set_zlabel('z')
ax.set_title(['$\theta = $' + str(round(theta, 2))+' '+'$ phi = $' +
str(round(phi, 2))+' '+'ratio_xy=' + str(round(ratio_xy, 2))])
plt.show()
|