绘图
本页面将会将常用的MATLAB和Mathematica命令总结出来,便于快速使用
MATLAB
MATLAB如何绘图而不显示?
1
2
3
| f = figure('visible','off');
plot(a)
saveas(f,'newout','fig')
|
MATLAB如何设置图片宽度和大小
1
| set(gcf,'units','normalzied','position',[x,y,width,height])
|
MATLAB绘图使用全屏
1
| f=figure('visible','on','units','normalized','outerposition',[0 0 1 1]);
|
MATLAB如何使用-tight-subplot
1
2
3
4
5
6
7
8
9
10
11
|
fig1=figure(1);
set(gcf,'units','normalized','Position', [0.1 0.1 0.6 0.8])
[ha, pos] = tight_subplot(4,4,[.05 .01],[.1 .1],[.05 .05]);
for l=1:16
axes(ha(l));
pcolor(x_grid,y_grid,decay_sort(:,:,l));shading interp;colormap jet;colorbar;
axis tight
end
sgtitle('original data')
|
MATLAB让NAN变成0
matlab打印当前时间以及显示信息
1
2
| showtext=[datestr(now, 'yyyy-mm-dd HH:MM:SS'),' Connecting to server succssfully! \n'];
fprintf(showtext);
|
MATLAB关闭提示信息
1
2
3
| w = warning('query','last');
id = w.identifier;
warning('off',id);
|
MATLAB导出EPS高清图片
1
2
| set(gcf,'Renderer','Painter');
hgexport(gcf,figure_save);
|
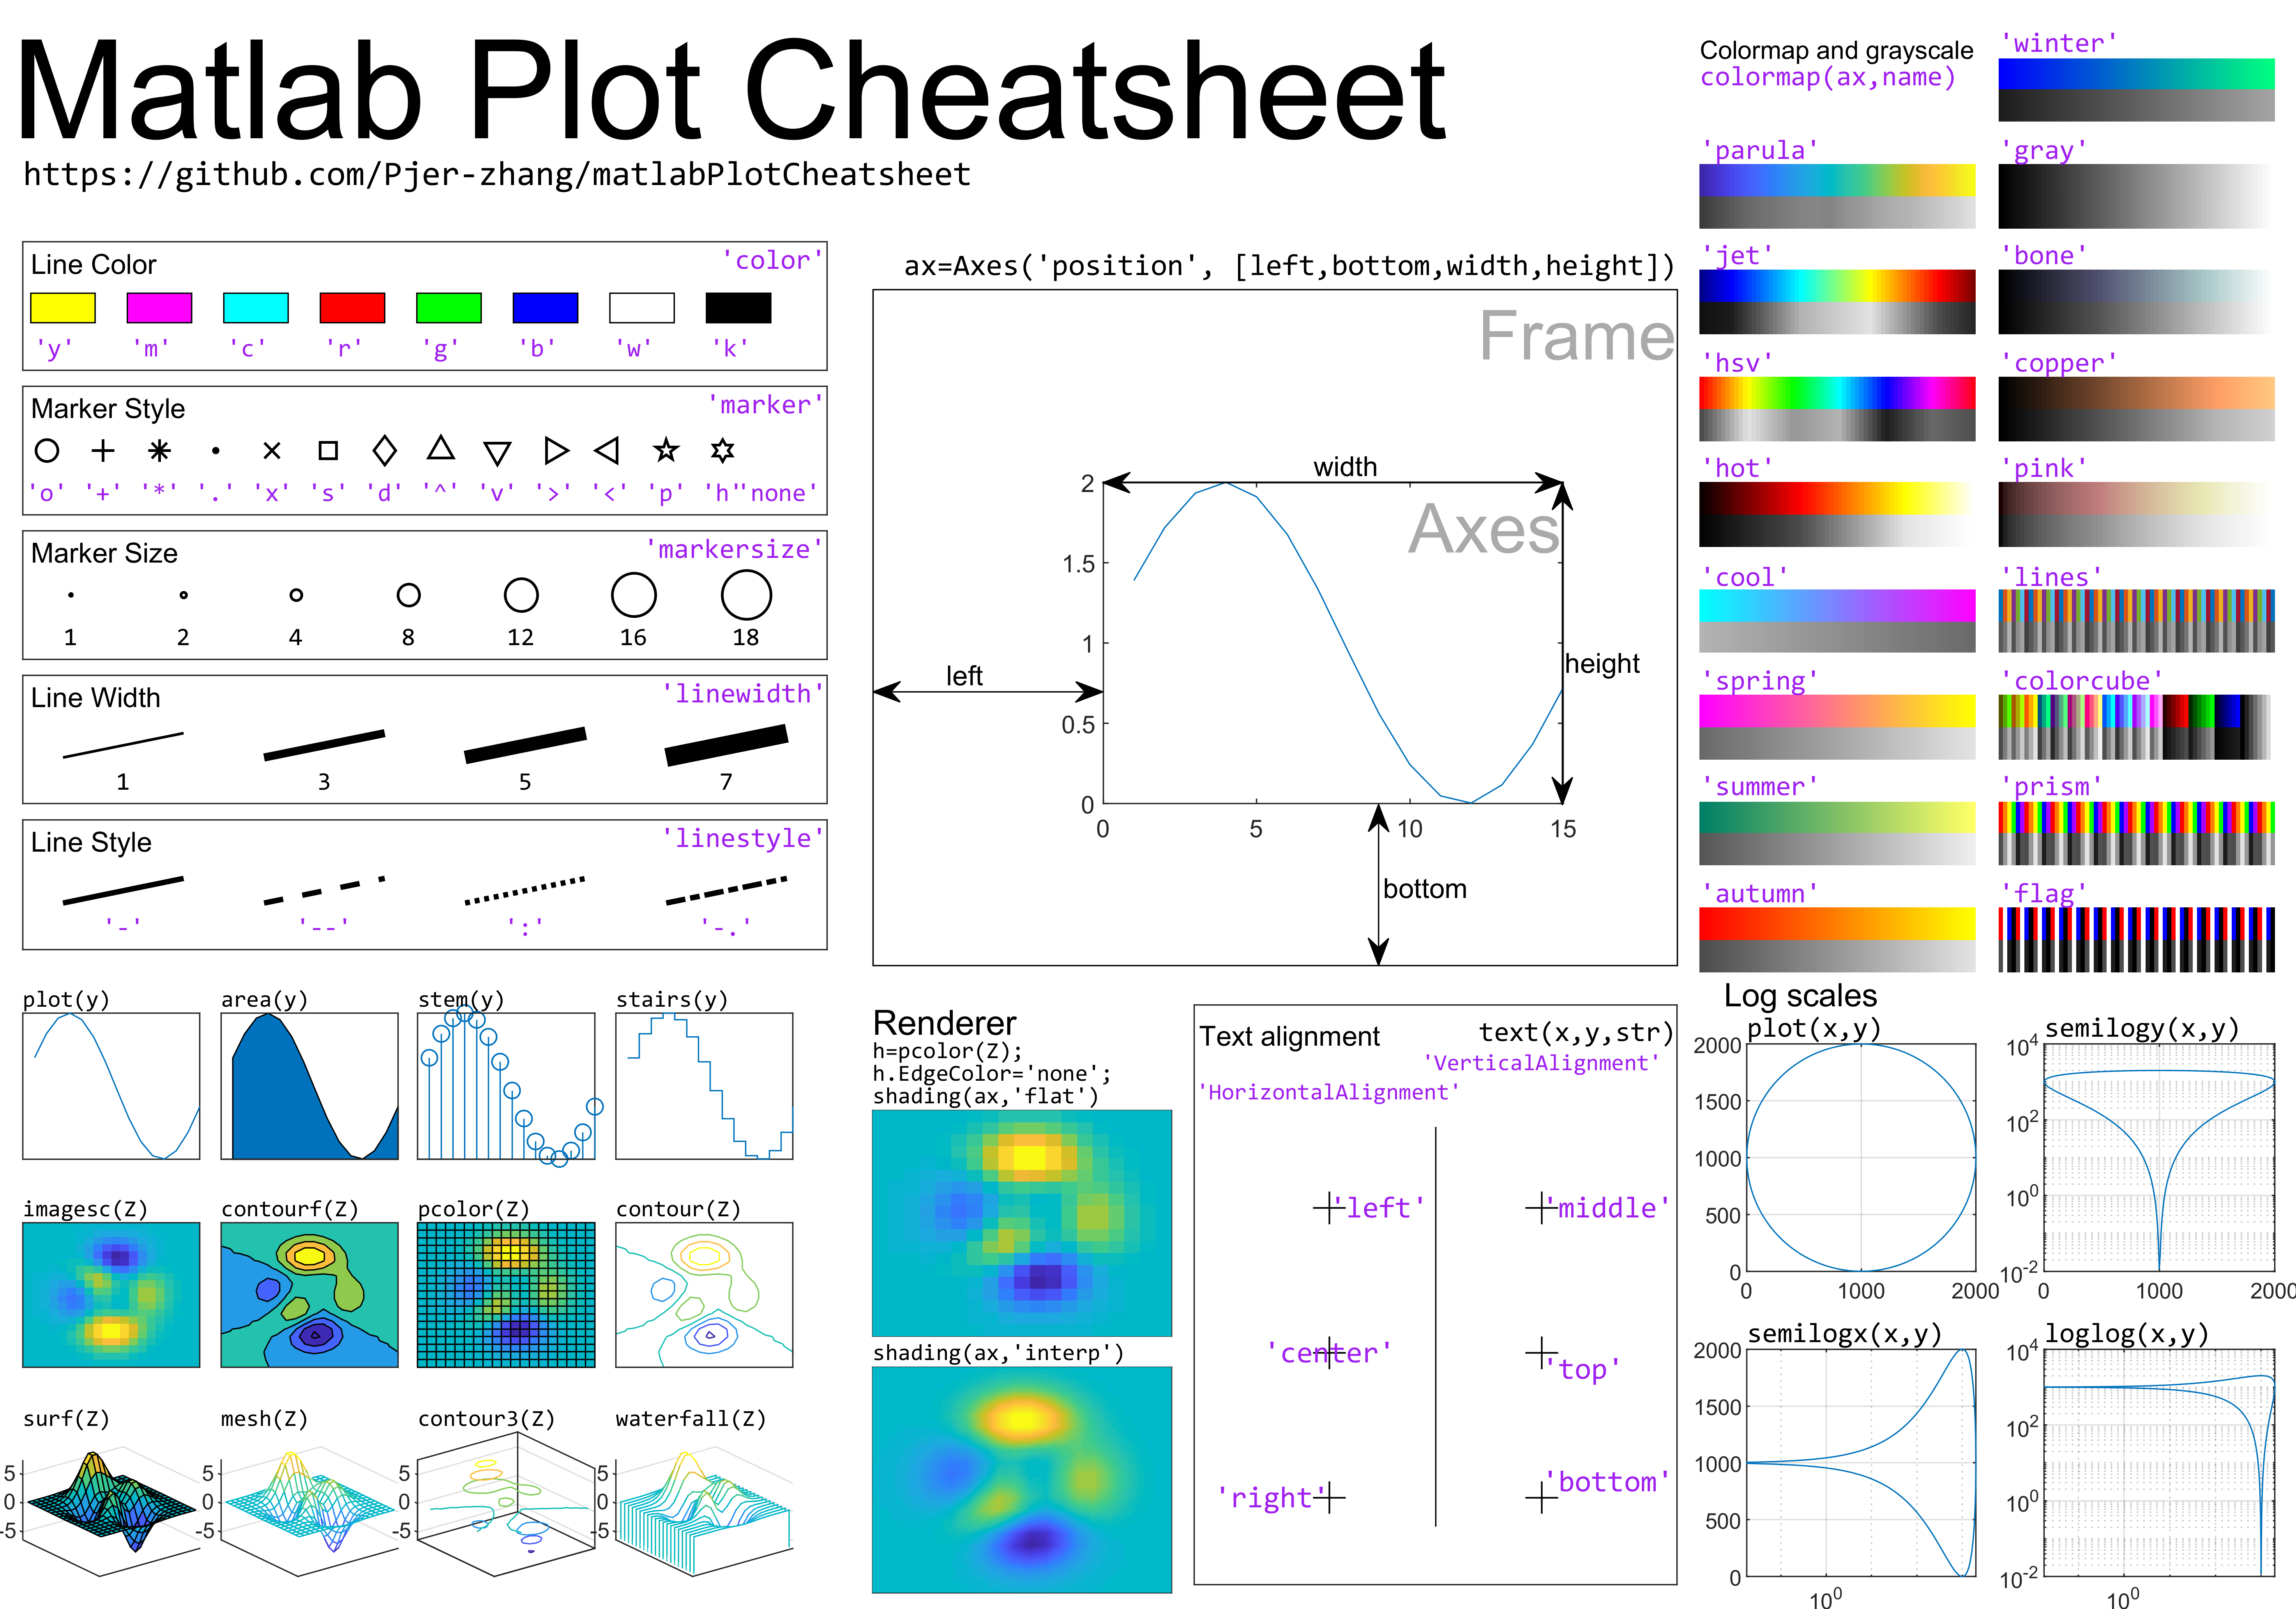
matlab绘图速查表
MATLAB如何改变坐标和字体
输出为PNG
1
2
3
4
5
| set(gcf,'Renderer','opengl');
figure_save = 'BraggMirror_EigenValues.png';
print(gcf, figure_save, '-dpng', '-r300'); % 300 dpi
|
1
2
3
4
5
6
| xlabel('x');
ylabel('y');
set(gca,'FontName','times new roman','Fontsize',15,'XColor','k','YColor','k','LineWidth',1.3);
set(gcf,'Renderer','Painter');
hgexport(gcf,figure_save);
|
MATLAB颜色图
为了绘制出合适的图像:
1
| cmap={"#0072BD","#D95319","#EDB120","#7E2F8E","#77AC30","#4DBEEE"};
|
Mathematica
一般的线图
1
2
3
4
5
6
| Frame -> True,
FrameLabel -> {"x", "y"}, Joined -> True,
PlotRange -> {{0, 7}, {0, 0.1}},
LabelStyle ->
Directive[FontSize -> 20, FontFamily -> "Times", FontColor -> Black],
FrameStyle -> Directive[Black, Thickness -> 0.005], PlotLegends -> Placed[{"Re", "Im", "Abs"}, {0.2, 0.5}]]
|
如何固定每一个图的轴大小是定值?
需要手动设置图的大小以及图框的填坑比例
1
2
3
4
5
6
7
8
9
10
11
| ImagePaddingSet = {{80, 20}, {50, 15}};
Ratio=1/1.25;
LabelStyle ->
Directive[FontSize -> 20, FontFamily -> "Helvetica",
FontColor -> Black], FrameStyle ->
Directive[Black,
Thickness ->
0.005], PlotStyle -> StyleLine, AspectRatio -> Ratio, ImagePadding \
->ImagePaddingSet, ImageSize -> 400
|
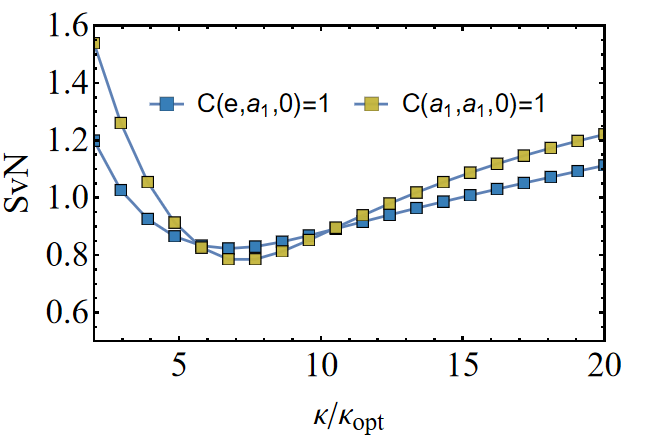
图例自定义形状和位置
一些设置marker的方法
绘制好看的点线图,可以自己设置矩形的图例
1
2
3
4
5
| Marker1 = Table[{Graphics[{EdgeForm[Thickness[0.1]], RGBColor[{
Rational[11, 51],
Rational[42, 85],
Rational[184, 255]}], Polygon[CirclePoints[4]]}], 0.04}, {i, 1, L,
1}];
|
也可以自己修改位置
1
2
3
4
5
6
7
8
9
10
11
12
13
14
15
16
17
18
19
20
21
| l1 = ListLinePlot[Thread[{\[Kappa]swep, SvNCea1}],
PlotMarkers -> Marker1, PlotRange -> {{2, 20}, {0.5, 1.6}},
Frame -> True,
LabelStyle ->
Directive[FontSize -> 20, FontFamily -> "Times",
FontColor -> Black],
PlotLegends ->
Placed[LineLegend[{"C(e,\!\(\*SubscriptBox[\(a\), \(1\)]\),0)=1"},
LabelStyle -> {FontFamily -> "Helvetica", FontSize -> 15,
Black}, LegendLayout -> {"Column", 1}], {0.5, 0.75}],
FrameStyle -> Directive[Black, Thickness -> 0.005],
FrameLabel -> {"\[Kappa]/\!\(\*SubscriptBox[\(\[Kappa]\), \(opt\)]\
\)", "SvN"}];
l2 = ListLinePlot[Thread[{\[Kappa]swep, SvNCa1a1}],
PlotMarkers -> Marker2,
PlotLegends ->
Placed[LineLegend[{"C(\!\(\*SubscriptBox[\(a\), \
\(1\)]\),\!\(\*SubscriptBox[\(a\), \(1\)]\),0)=1"},
LabelStyle -> {FontFamily -> "Helvetica", FontSize -> 15,
Black}, LegendLayout -> {"Column", 1}], {0.5, 0.75}]];
Show[l1, l2] // fixTickThickness
|
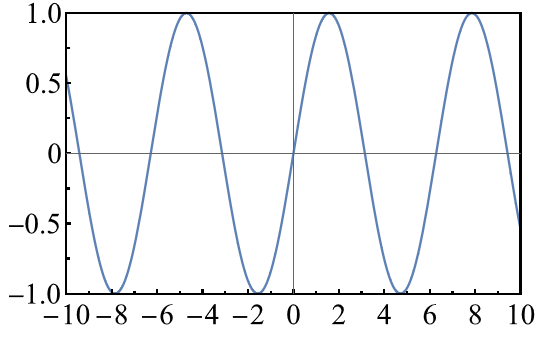
手动设置Ticks
1
2
3
4
5
6
7
8
| p1plot = Plot[Sin[x], {x, -10, 10}, Frame -> True,
PlotRange -> {{-10, 10}, {-1, 1}},
LabelStyle ->
Directive[FontSize -> 20, FontFamily -> "Times New Roman",
FontColor -> Black],
FrameStyle -> Directive[Black, Thickness -> 0.005],
FrameTicks -> {{Charting`ScaledTicks["Linear"][-1, 1, {5, 2}],
None}, {Charting`ScaledTicks["Linear"][-10, 10, {10, 2}], None}}]
|
Colorbar的设置
1
2
3
4
| PlotLegends ->
Placed[BarLegend[{"TemperatureMap", {0, pMax}}, None,
"Ticks" -> {0, 0.3, 0.6, 0.9, 1.2, 1.5}, LegendMarkerSize -> 125,
LegendMargins -> {{-15, 0}, {0, 0}}], Right]
|
绘制一般的线图,默认参数
1
2
3
4
5
6
7
| FrameLabel -> {"\[Theta]", "Probability"}, Frame -> True,
PlotLegends ->
Placed[{"xx"}, {0.5,
0.6}], PlotTheme -> "Scientific", LabelStyle ->
Directive[FontSize -> 15, FontFamily -> "Helvetica",
FontColor -> Black], FrameStyle ->
Directive[Black, Thickness -> 0.005]
|