Python生成Origin或者MATLAB的Pal格式的颜色图文件
Python #MATLAB #origin #colormap
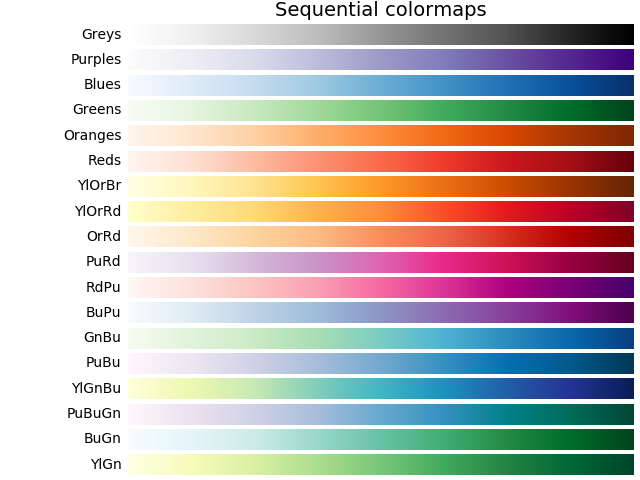
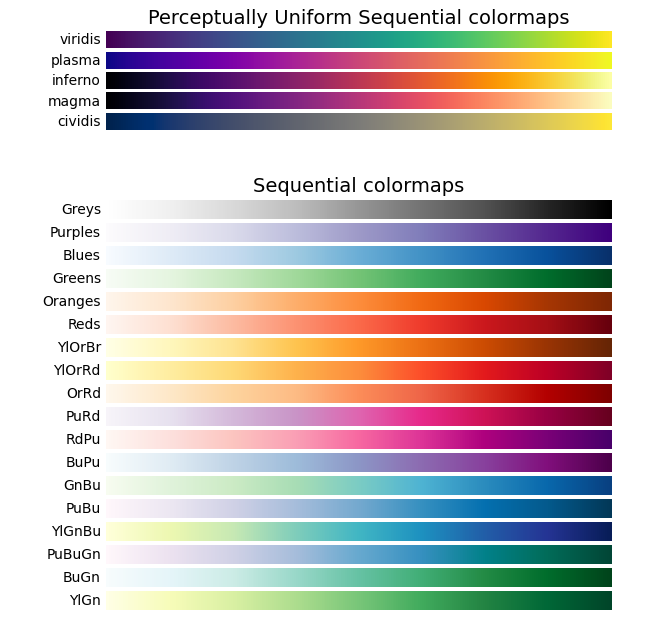
Python的颜色图( colormaps)非常多而且非常好看,在用Origin或者MATLAB的时候自己也想用Python的颜色图,因此写了这样一个程序。其中用Python生成MATLAB程序已经在另外一篇博客介绍过了[Software&Program/MATLAB/C_教程_MATLAB如何自定义颜色曲线],网络链接为MATLAB如何自定义颜色曲线
而Python生成Origin的Pal文件则需要保存为二进制数据,并且得有一些头文件的信息输出。我参考了MATLAB的一个函数cmap2pal
这里面最关键的输出二进制文件的操作为:1
2
3
4
5
6
7
8
9
10
11
12
13
14
15
16
17
18
19
20
21
22
23
24
25
26
27
28
29
30
31
32%% Open file
fid=fopen(path,'w',mf);
if(fid<0)
throw(MException('cmap2pal:Open','Error opening file (%s) for writing',path));
end
%% Write RIFF signature
fwrite(fid,'RIFF','uint8',0,mf);
%% Write file length
fwrite(fid,flen-8,'uint32',0,mf); % 8 byte header (RIFF header)
%% Write PAL signature
fwrite(fid,'PAL ','uint8',0,mf);
%% Write data signature
fwrite(fid,'data','uint8',0,mf);
%% Write data block size
fwrite(fid,flen-20,'uint32',0,mf); % 20 byte header (RIFF + Chunk)
%% Write version number
fwrite(fid,[0,3],'uint8',0,mf); % Always 3
%% Write palette length
fwrite(fid,depth,'uint16',0,mf);
%% Write palette data
fwrite(fid,[cmap.*255,zeros(depth,1)]','uint8',0,mf); % RGBA tuples
%% Close file
fclose(fid);
Python为了生成二进制文件,需要借助包struct
里面关于数据的输出格式是这样的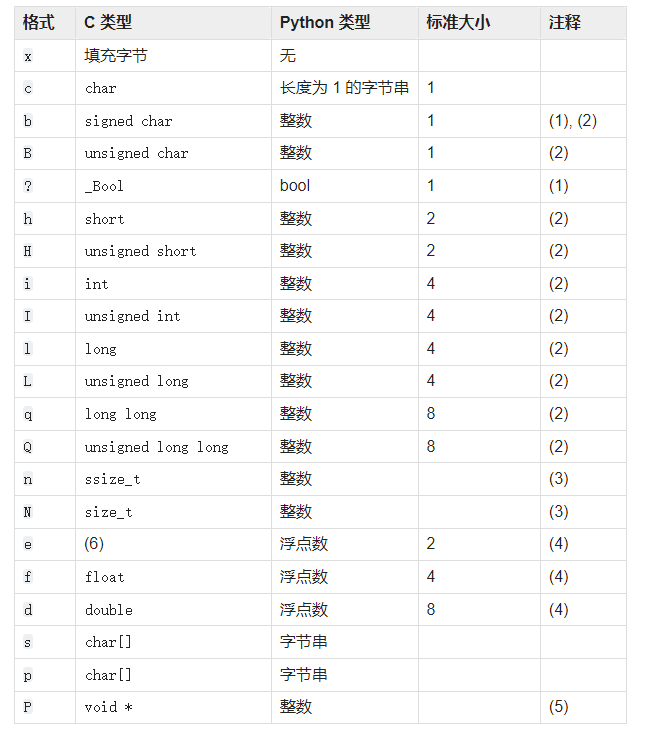
而对应的MATLAB格式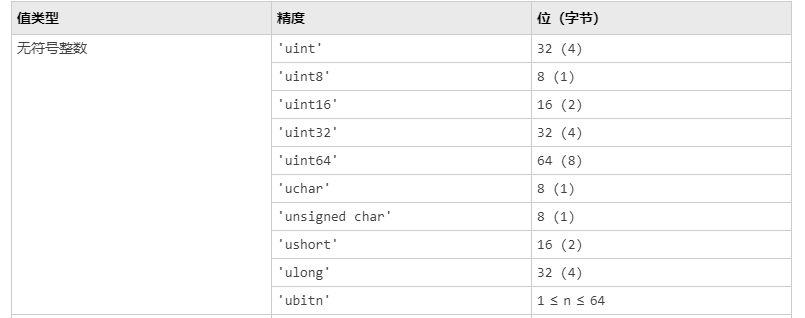
通过在StackOverflow知道了正确的代码书写方式,我还写了一个图形界面版本,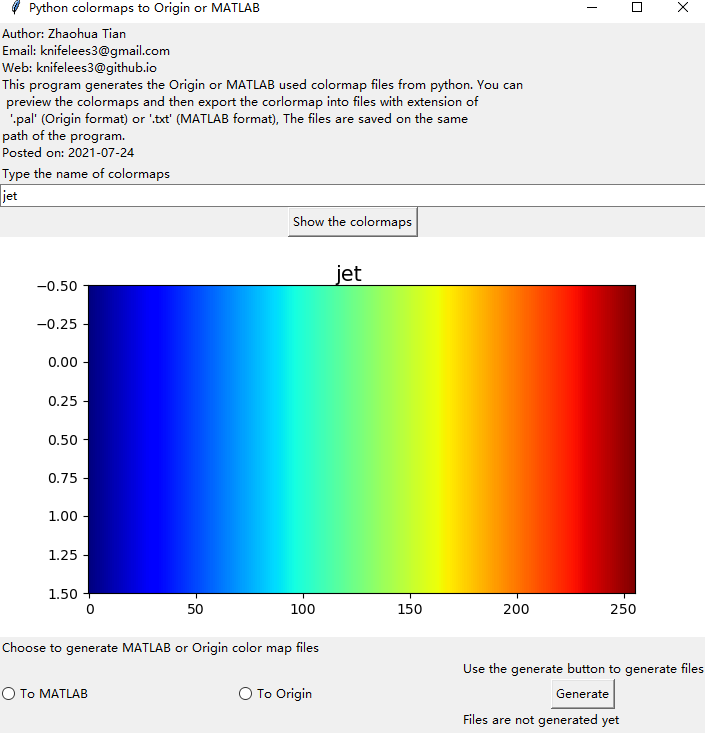
代码详情可见我的github地址:
# pycmap2palormat